Hardware Life Cycle Emissions
The carbon footprint of an organisation’s technology encompasses total emissions across the entire product life cycle, from raw material extraction through manufacture, transportation, usage, and disposal.
Broadly, the full life cycle view can be divided into two main groups: embodied carbon and usage carbon.
\[C = C_E + C_U\]Where
- C is total life cycle carbon emissions (kg CO2e).
- CE is embodied carbon emissions (kg CO2e).
- CU is usage carbon emissions (kg CO2e).
To measure an organisation’s technology carbon footprint, it is essential to consider the full product life cycle emissions.
Read more about embodied carbon emissions.
Read more about usage carbon emissions.
Life Cycle Emissions Data
A comprehensive Life Cycle Assessment (LCA) is necessary to fully quantify the environmental impacts across all stages of a product’s life cycle. Many manufacturers choose to provide Product Carbon Footprint (PCF) data for their products. A PCF provides an estimate of the greenhouse gas emissions attributable to a product over its full life cycle. This differs from an LCA, which considers broader environmental impacts beyond just greenhouse gas emissions (for example, water consumption, and land usage).
Several international standards provide guidelines for estimating environmental impacts such as ISO 14040, ISO 14044, ISO 14067, and IEC TR 62921. These standards outline different approaches and outputs, which can be difficult to reconcile. A widely used methodology in the ICT industry to quantify greenhouse gas (GHG) emissions and estimate product carbon footprints is the Product Attribute to Impact Algorithm (PAIA), although it is not strictly compliant with such standards. Methodologies can still vary between manufacturers so published figures require careful scrutiny to determine comparability.
Here are some examples of environmental reports, PCF documents, and LCAs from prominent manufacturers that detail the carbon footprints of their products over the full life cycle:
- Apple Environmental Reports
- Dell Product Carbon Footprints
- HP Product Carbon Footprints
- Samsung Life Cycle Assessment
Reported emissions figures typically represent the mean value of carbon footprint estimates. Reported standard deviations or variances highlight the uncertainty inherent in these estimates, arising from the complexities involved in capturing accurate emissions data from manufacturing, transportation, and real-world usage scenarios.
Embodied vs Usage Carbon
The total embodied carbon of an asset can be amortised over its expected lifetime, if information about its typical refresh cycle or life span is available. This enables understanding the annual carbon emissions attributed to embodied carbon. By amortising the embodied carbon over the product’s lifetime, it allows a like-for-like comparison against annual usage emissions.
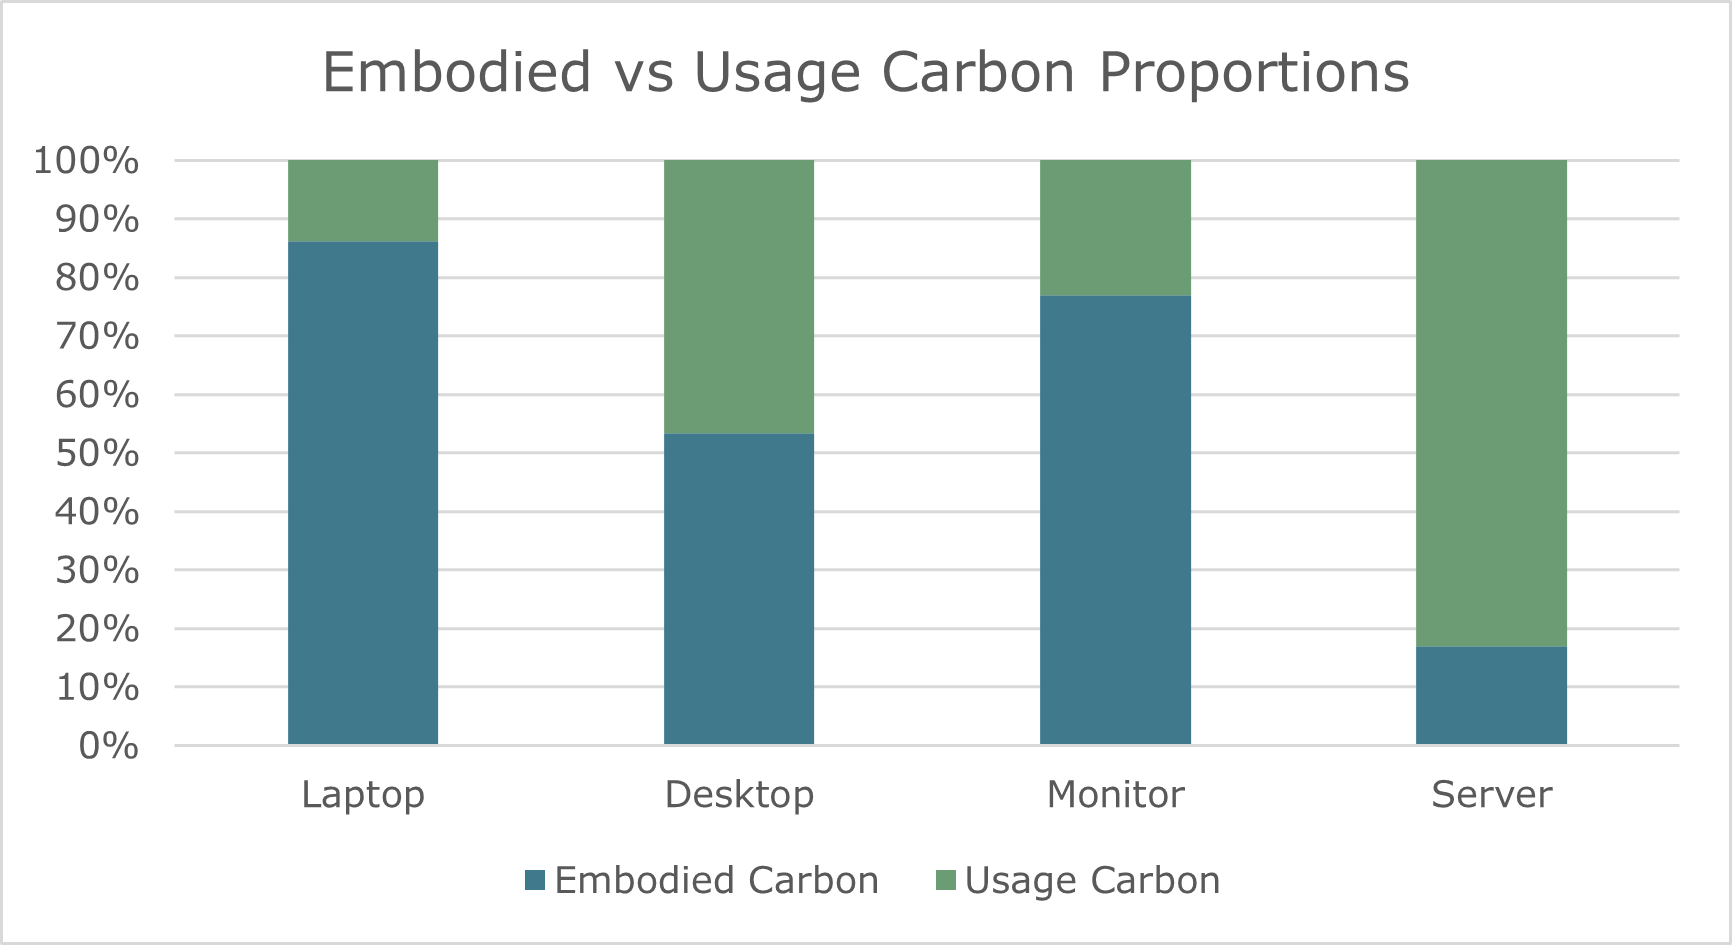
The ratio of embodied carbon to usage carbon varies across different types of device or product. In some cases, the embodied carbon associated with a product can exceed the carbon emissions from its usage, underscoring the importance of considering both when assessing the total carbon footprint.
The following charts demonstrate the carbon emissions attributed to usage versus embodied carbon across various hardware types. Figures shown in the graphs are derived from an example of one hardware model per device type. In reality, such figures will differ depending on the particular device model and its usage context.

Source: Dell Product Carbon Footprint (PCF) documents for an example model of Laptop1, Desktop2, Monitor3, and Server4.
For devices such as laptops, embodied carbon typically accounts for around 80% of the total life cycle emissions, while usage emissions make up only 20%. In contrast, for servers, the breakdown can be reversed, with embodied carbon constituting around 20% and usage emissions around 80% of the total. These proportions can fluctuate depending on the specific device model. Desktops tend to have a higher proportion of usage emissions compared to other user devices like laptops or smartphones.

Source: Dell Product Carbon Footprint (PCF) documents for an example model of Laptop1, Desktop2, Monitor3, and Server4.
Worked Examples
Click here to see a worked example of estimating life cycle emissions for a laptop.
Click here to see a worked example of estimating life cycle emissions for a server.